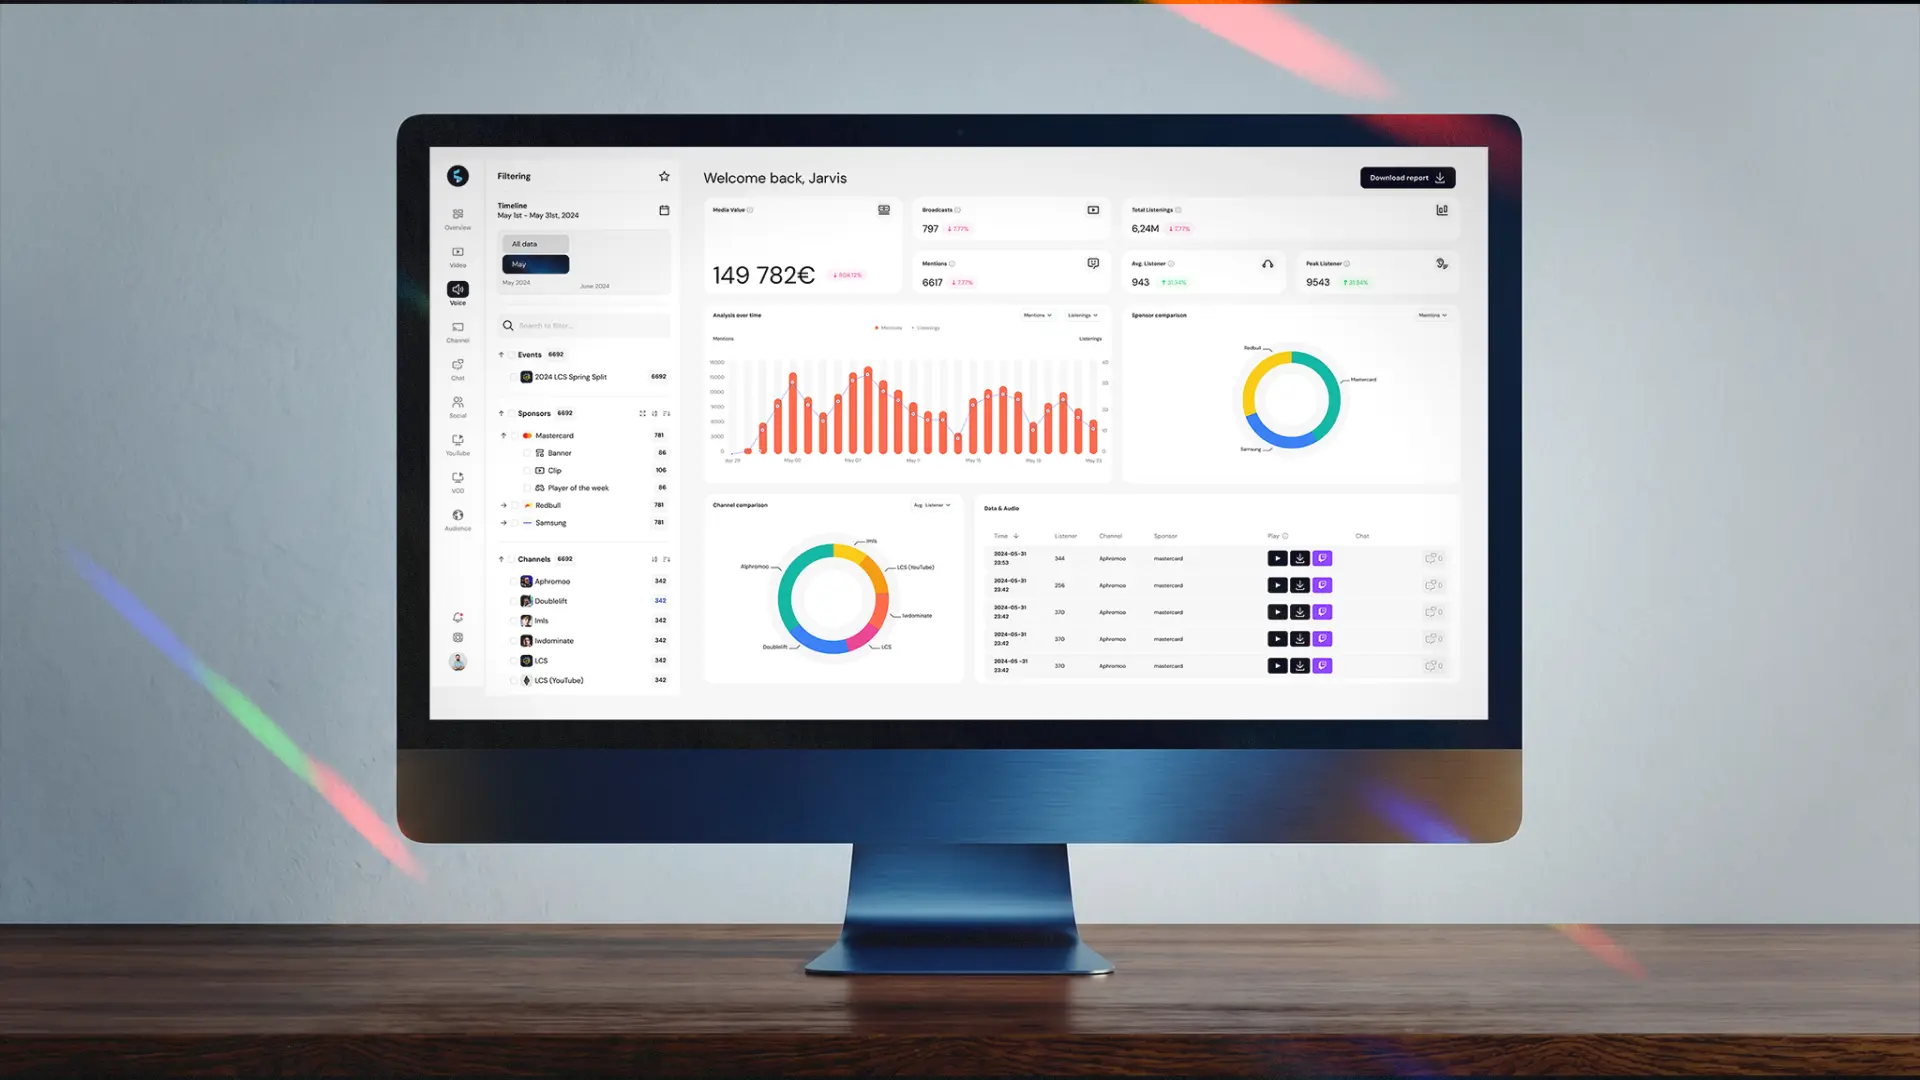

Event sponsorship analytics software should measure four things: total media value across every channel, competitive benchmarking against co-sponsors, audience composition by demographic and geography, and audio plus text coverage from commentary, press and creators. Most tools handle visual exposure well and miss the last three.
Here is what your analytics software should actually be showing you across each one.
The Four Questions Every Sponsor Asks at Renewal
These four questions have become standard across renewal conversations of every type. They all trace back to the same underlying need: proof that the investment delivered, measured in enough detail to justify what comes next. The table below shows where the gap typically appears, and what your software needs to show to close it.
Here is what covering all four actually looks like in practice.
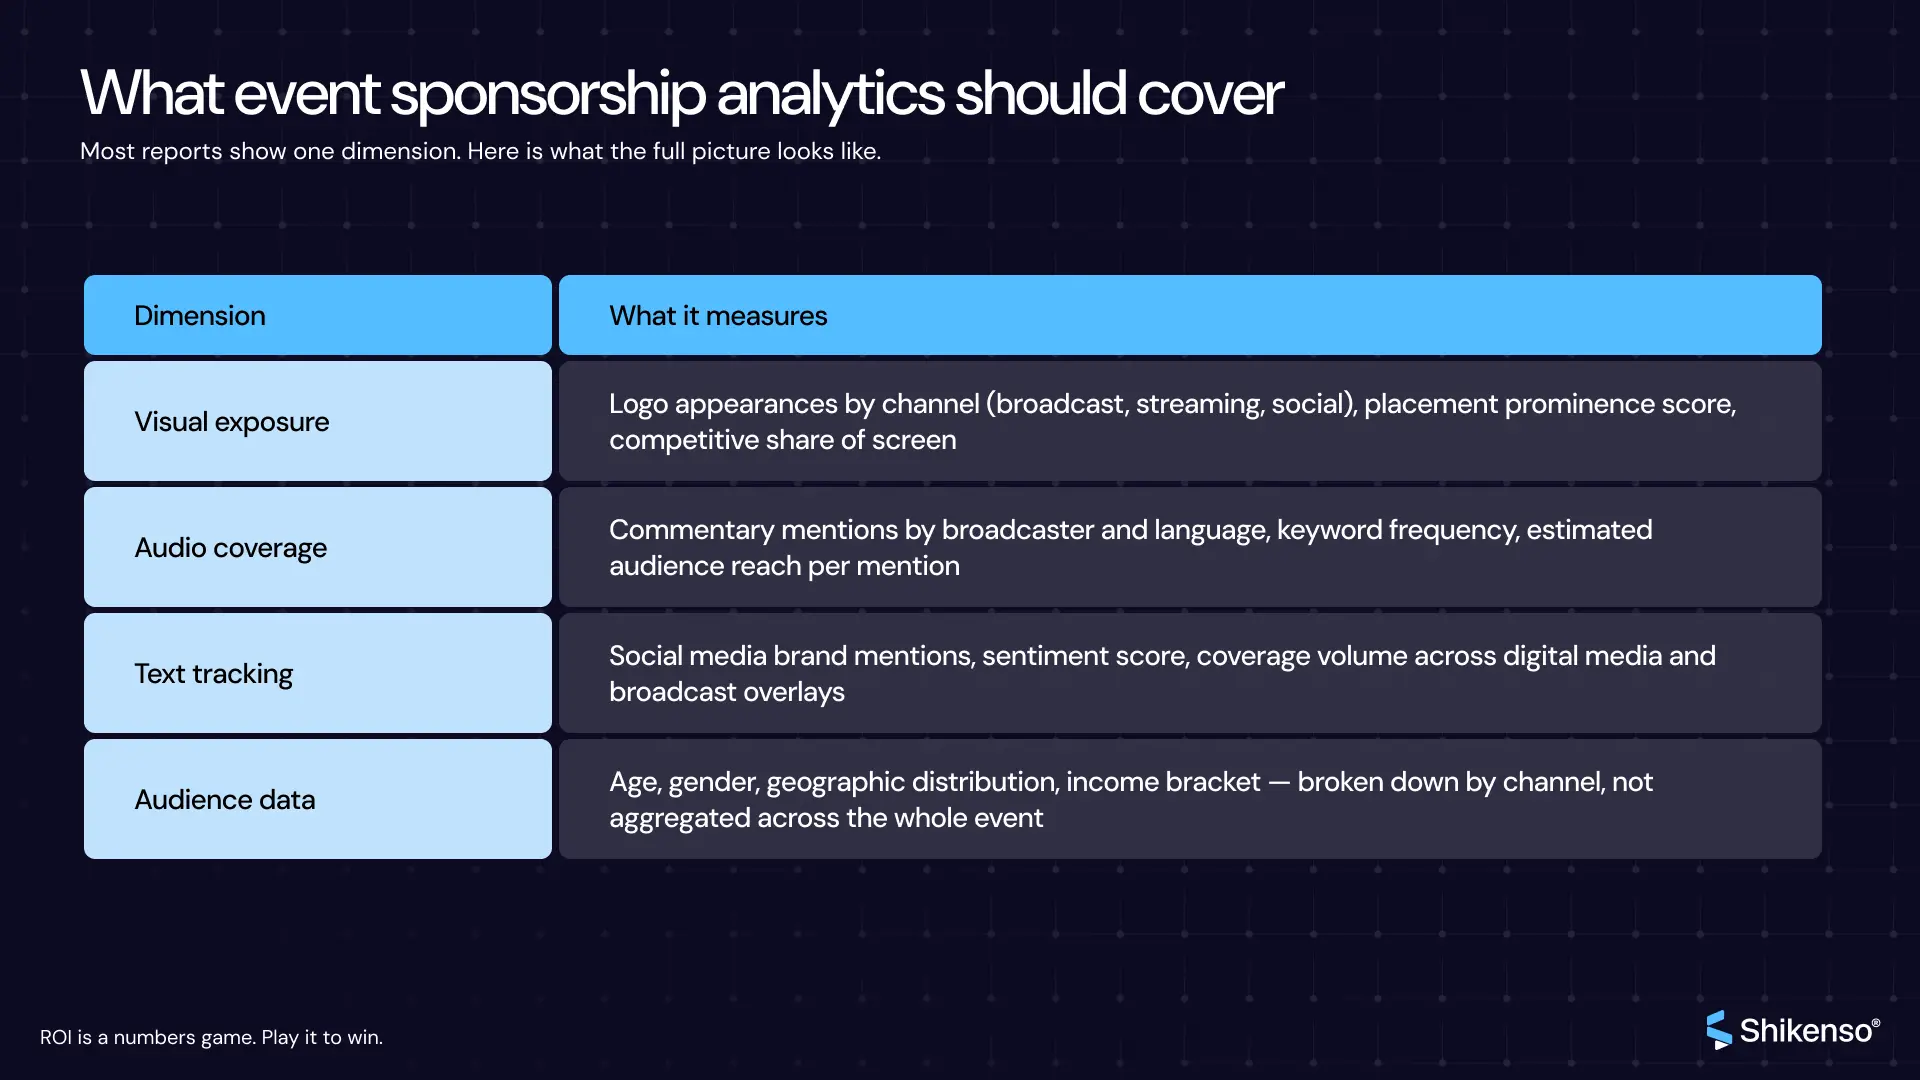
Visual Tracking: Beyond Logo Count
Logo count and estimated airtime are the baseline, and most platforms deliver those adequately. Placement prominence, screen share percentage, and competitive context are what convert raw airtime into an accurate media value figure. How many other brand assets appeared in the same frame determines what that airtime is actually worth, and most platforms either approximate or omit this entirely.
Coverage breadth matters just as much. Streaming platforms, social clips, and digital media generated by the event all carry visual brand exposure. A platform that only processes the primary broadcast feed is structurally undercounting what the event delivered.
Audio and Text: The Dimensions That Disappear From Most Reports
Most event sponsorship reports account for what the camera captured. What the microphone picked up, what journalists wrote, and what creators posted rarely makes it into the same document. These are not edge cases. They represent a substantial share of the total value an event generates for its partners.
Broadcast Commentary
When a broadcaster names a sponsor during a key moment, that is an audible impression delivered to the entire viewing audience simultaneously. A platform that only counts logos will not capture it.
At major sports and esports events, audio mentions can represent a significant share of total exposure value. Our platform tracks commentary across 200+ languages, covering every co-cast and regional broadcast rather than only the primary feed.
Earned Media and Press Coverage
Post-event press coverage extends a sponsor's reach well beyond what any owned channel produces on its own. When an industry publication runs an event recap and names a title sponsor, or when a journalist references a brand in a match report, that is trackable text exposure with measurable media value.
Software that does not capture these channels structurally undercounts what the sponsorship delivered. Earned coverage shows up in several trackable formats, each carrying measurable media value:
Creator and Influencer Activations
Creators invited to cover an event generate content across TikTok, Instagram, YouTube, and Twitch that can reach audiences far larger than any owned social channel. If those activations are not tracked, neither is the value they produce for sponsors.
Dedicated creator campaign tracking closes that gap. Beyond logging views, a proper system verifies four things against the brief:
Without that layer, there is no way to tell sponsors what their investment in creator activations returned.
Volleyball World, which broadcasts events across live TV, replays, VBTV, and social simultaneously, chose Shikenso because comprehensive coverage across visual, audio, and earned channels gave their partners a measurement standard that logo-detection tools alone could not match.
Understanding what AI-powered sponsorship analytics actually tracks makes clear how wide that gap can be.
Audience Data: What Knowing Who Was Watching Actually Requires
Reach and impressions quantify exposure volume. Demographic breakdown is what tells a sponsor whether that exposure reached the audience that actually matters to their business. If your platform cannot surface that data, the renewal conversation happens on the sponsor's terms, not yours.
Geographic breakdown carries equal weight for events with international coverage. The Belgian Pro League, covering 29 clubs across multiple European broadcast territories, works with us because sponsors managing regional budgets need market-by-market audience data, not a single aggregated figure that flattens those distinctions.
Closing the Gap Between Report and Renewal
The standard is clear: your analytics software should answer all four questions, with data that reflects everything the event touched across every channel. Gaps in that coverage surface in renewal conversations, in the questions sponsors ask that you cannot fully answer, and in the deals that stall because the value was not demonstrated clearly enough.
Jasper Ramm, CEO at OMR Festival, one of Europe's largest marketing events with 70,000+ professionals annually, described the shift after working with Shikenso at OMR Festival 2025:
That shift, from guesswork to sponsor-specific, channel-by-channel proof, is what turns a report into a renewal argument. Across 300+ social accounts and 20 partners monitored at OMR Festival 2025, seven million branded impressions and €130,000 in measurable media value were generated through OMR's own digital ecosystem alone.
We cover all four dimensions from a single source. If you want to see what that looks like for your events, book a demo below.
FAQ
How do you track logo exposure?
Logo exposure tracking uses computer vision to detect brand placements frame by frame across broadcast, streaming and social, then scores each by size, duration and screen prominence. Logo count alone is the baseline. Shikenso converts prominence and competitive context into a media value figure, so airtime reflects what it was actually worth.
What are the best tools for measuring the impact of sponsored events?
The best tools measure impact across four dimensions rather than one: total media value, competitive benchmarking, audience composition, and audio plus text coverage. Most platforms track visual exposure well and stop there. Shikenso measures all four from a single source, covering broadcast, streaming, social, commentary and earned press together.
How can sports organisations measure sponsor mentions in broadcasts?
Sponsor mentions in broadcasts are audible impressions that logo detection cannot see. Measuring them needs speech tracking across commentary, co-casts and regional feeds. Shikenso tracks broadcast commentary in 200+ languages across every regional broadcast, so verbal sponsor mentions are counted and valued alongside on-screen exposure rather than lost.
What is the best software for visual sponsorship tracking?
The best visual sponsorship tracking software goes beyond logo count to score placement prominence, screen share and competitive context across every feed, not just the primary broadcast. Shikenso processes broadcast, streaming and social clips together, so visual exposure reflects the full footprint of an event instead of a single channel.
What is sports sponsorship measurement?
Sports sponsorship measurement is the practice of quantifying the value a sponsor receives from an event across visual, audio, text and audience data, then expressing it as media value. It answers what exposure was worth, how it compared to co-sponsors, and who saw it. Shikenso measures all four dimensions in one platform.
How is event sponsorship media value calculated?
Media value estimates what sponsor exposure would have cost as paid media. Each impression is monetised using its channel, prominence and audience, then summed across broadcast, streaming, social, commentary and press. Shikenso applies this across all four dimensions from a single source, so the figure reflects everything the event touched, not only visual placements.

Related reads


Get new insights straight to your inbox
Don’t miss out on the insights that the press and media rave about!